How to Use Sell-Through Rate Data to Reorder or Discontinue Kids Optical Frames?
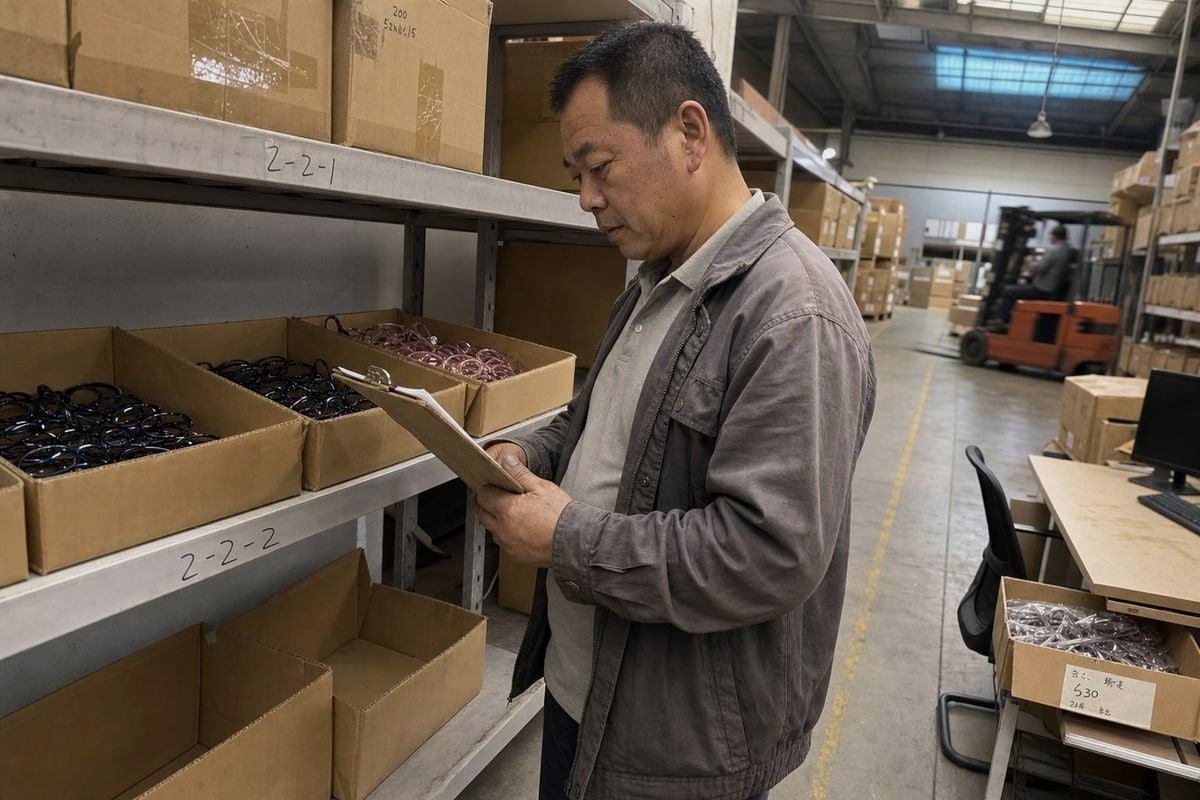
Sell-through rate data 1 tells you which kids optical frames deserve a reorder and which are quietly draining your cash. On our production line in Taizhou, I see both outcomes every week.
Use sell-through rate data by comparing units sold to units received per SKU. Reorder kids optical frames above roughly 60–70% sell-through per season, monitor styles at 40–60%, and discontinue frames with under 20% movement or zero sales in twelve months, adjusting for age group and price point.
That single rule covers most cases. But kids eyewear has quirks that adult frames do not. Let me walk you through the details, section by section.
What sell-through rate should I expect before deciding to reorder a kids' optical style?
A buyer from Australia once asked me why her best-looking pink acetate frame was not selling. Her sell-through report answered before I could: the size ran large for her market's average age.
Expect a sell-through rate of 60–70% or higher within one season before reordering a kids' optical style. Pair this with an inventory turnover ratio of at least 3 turns per year. Anything below 40% sell-through after six months signals a problem worth investigating first.
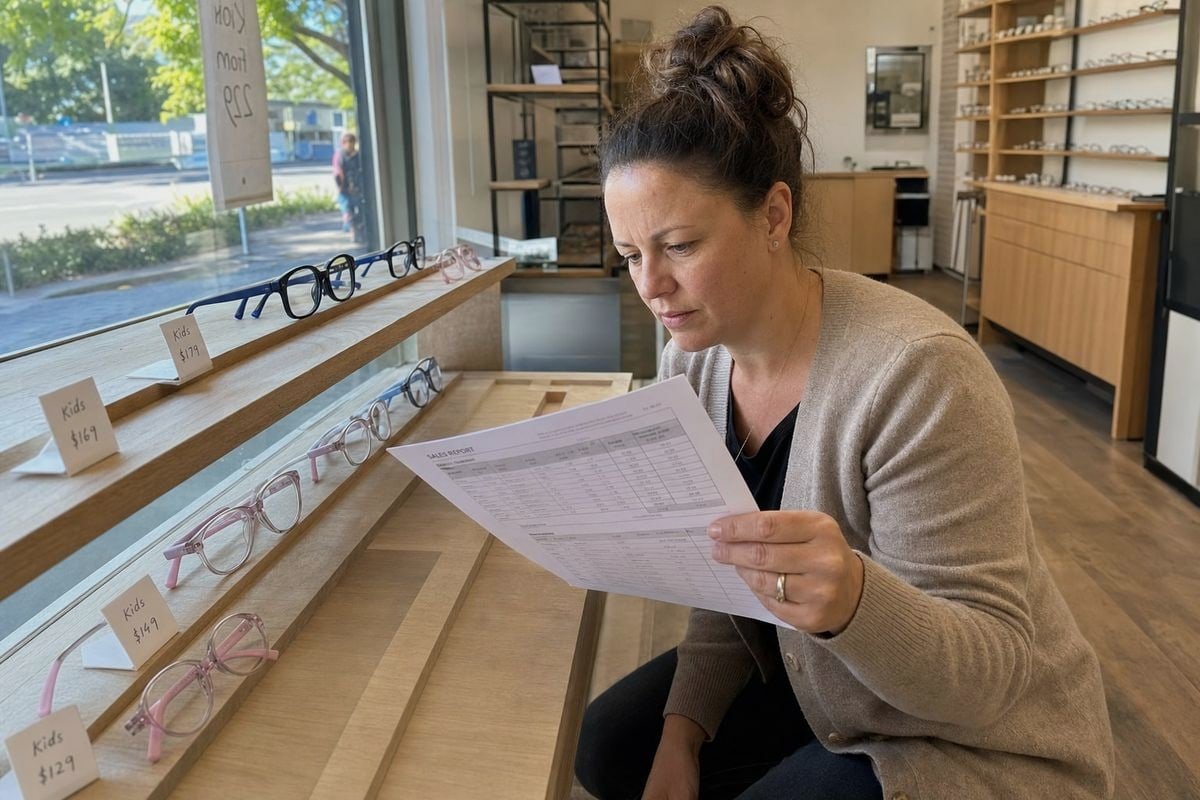
Sell-through rate is simple math. Divide units sold by units received, then multiply by 100. If you brought in 12 pieces of a TR90 kids frame 2 and sold 8 in the review period, your sell-through is 67%. That frame is earning its board space.
But the raw number needs context. In our fifteen years of making children's eyewear, we have seen the same style hit 80% sell-through in one market and 25% in another. The difference was almost never the frame. It was the fit for the local age mix, the price point versus insurance coverage, and the season.
Benchmarks that actually work for kids frames
Here is the framework I share with optical buyers who order from our catalog:
| Sell-Through (per season) | Turn Rate Signal | Aktion |
|---|---|---|
| 70%+ | 3–4+ turns/year | Reorder immediately, consider deeper stock |
| 50–69% | ~3 turns/year | Reorder at same or slightly lower depth |
| 30–49% | 2–3 turns/year | Keep but monitor; check display and pricing |
| Under 30% | Below 2 turns/year | Markdown, exchange, or discontinue |
Why turn rate and sell-through belong together
Sell-through shows SKU-level productivity. The Umsatzverhältnis 3 shows whether your whole kids board converts cash efficiently. A healthy optical typically targets about 3 turns per year, and 3x to 4x is a reasonable goal for a pediatric section. One useful rule: a frame should not sit unsold longer than about twice your average turn period. On a 3-turn inventory, that means roughly eight months of shelf life before you act.
One more caution. Adjust for lost selling days. A frame that sold out in September and sat empty until November will show artificially low units. That is a bestseller disguised as a laggard, and cutting it would be a costly mistake.
How do I know if a slow-selling frame is worth discontinuing or just needs a design tweak?
There is a trade-off I weigh constantly at our factory: cut a style from our lineup of roughly 800, or fix it. Sell-through data usually points to which one, but only after you segment it properly.
Discontinue a kids frame with zero sales in twelve months, especially if it duplicates another style. But if a slow seller shows a pattern — wrong size, weak colorway, or breakage returns — a design tweak like adjusted fit, new colors, or a flexible TPEE temple can revive it.

Slow-moving inventory is not one problem. It is at least four different problems wearing the same disguise. Before you kill a style, run this diagnostic.
Step one: check for a fixable pattern
Look at the SKU level, not the style level. Children's frame choices are driven by exact color and size combinations. We have seen a rounded rectangular frame fail in glossy black yet succeed strongly in translucent soft pink with matte pastel temple tips. Same mold, different sell-through. If one colorway sells and two do not, the style is fine. The color assortment needs a tweak, and that is a fast fix with no new tooling.
Step two: calculate net sell-through
Subtract warranty claims and breakage returns from gross sales. A frame that sells well but comes back broken is not a keeper — it is a durability problem. This matters enormously in pediatric eyewear, because durability and warranty drive purchases for children up to about age 13, while fashion takes over after that. When a buyer shows us high breakage on a rigid frame, we usually propose a TR90 front with TPEE temples and silicone hinge connectors 4. The flexible material absorbs the abuse active kids deliver.
Step three: rule out display and assortment issues
Some frames sell slowly because they are under-displayed or positioned as niche fill-in styles, not because they are bad. Good frame board management means checking board placement before blaming the product. A smaller size for younger children may turn slowly yet still earn its slot by covering a fit gap.
| Symptom | Likely Cause | Best Action |
|---|---|---|
| Zero sales, 12 months, duplicate style exists | Redundant SKU | Discontinue |
| One colorway sells, others do not | Wrong colors | Tweak color assortment |
| Sells, then returns for breakage | Durability gap | Switch material or construction |
| Low sales, poor board position | Display issue | Reposition, then re-measure |
| Slow but fills a size or budget gap | Assortment role | Keep, reduce depth |
Also check your vendor exchange privileges before marking anything down. If your supplier accepts swaps for stale stock, an exchange beats a markdown every time.
Can my manufacturer help me interpret sell-through data to plan smarter reorders?
Last year, a Japanese kids brand sent us their quarterly sales summary and asked a blunt question: what should we reorder? That conversation changed how they buy, and honestly, how we advise.
Yes. A good manufacturer can benchmark your sell-through against other markets, flag which colorways and sizes perform globally, advise on minimum order quantities for replenishment, and adjust designs or materials for underperformers — turning raw optical retail analytics into a concrete reorder plan.
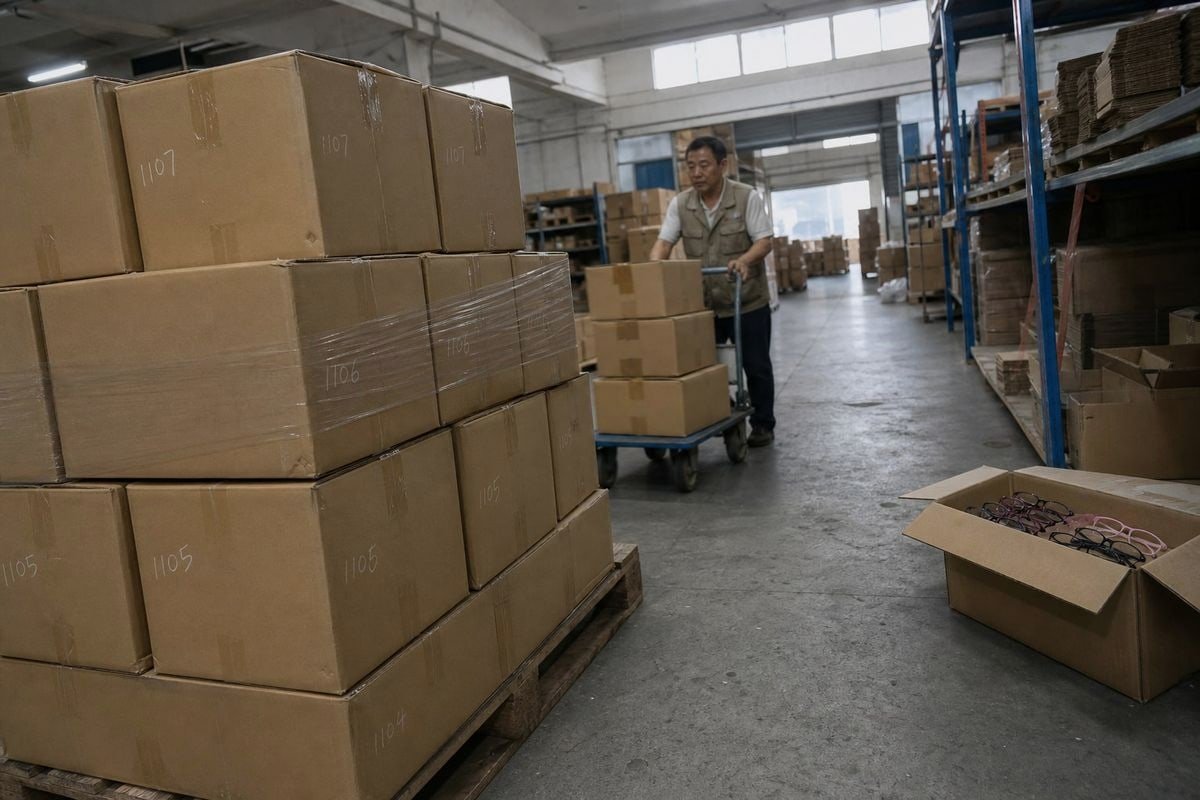
Most buyers treat their supplier as a fulfillment channel. That leaves value on the table. We produce children's eyewear for customers in more than twenty countries, so we see aggregated demand patterns no single retailer can see from their own data.
What a factory partner sees that you cannot
When your sell-through report shows a pastel translucent frame outperforming solid colors, we can tell you whether that matches pediatric eyewear trends 5 across Europe and Australia, or whether it is unique to your market. When your data shows a size gap, we can point you to the sizes other buyers reorder most for that age band. This is pattern recognition built from hundreds of styles and repeated production runs.
How the collaboration works in practice
Here is the process we run with brands that share their data:
- You share segmented sell-through — by SKU, age group, and price tier, not blended averages.
- We benchmark it against comparable styles from our catalog of about 800 designs.
- We flag quick wins — proven colorways you have not stocked, or a flexible-temple variant of a style that returns too often.
- We plan replenishment depth — small test reorders on borderline SKUs, deeper commitments on proven A-grade movers.
- We time production so goods land before back-to-school demand 6, not after it peaks.
That last point matters more than most buyers realize. Pediatric demand is cyclical. If your reorder arrives in October, you missed the season and your stock-to-sales ratio 7 suffers for two quarters. We build lead times backward from your peak selling window, and our 5S-managed workshop keeps those delivery commitments predictable.
There is one honest caveat. A manufacturer can interpret product performance, but only you know your local insurance mix, your patient demographics, and your board strategy. The best reorder plans combine both views. Treat your supplier's read as an input, not a verdict.
How do I use sell-through insights to choose which of the ~800 existing styles to test next?
Early in my time working with importers, I learned a lesson the hard way: buyers who pick new styles by gut feel churn through samples. Buyers who pick by data build assortments that turn.
Map your top-performing SKUs by shape, material, size, color family, and price tier. Then select new test styles from an existing catalog that match those winning attributes but fill gaps — a missing age size, an underserved low-bridge fit, or an unrepresented color — ordering small trial quantities first.
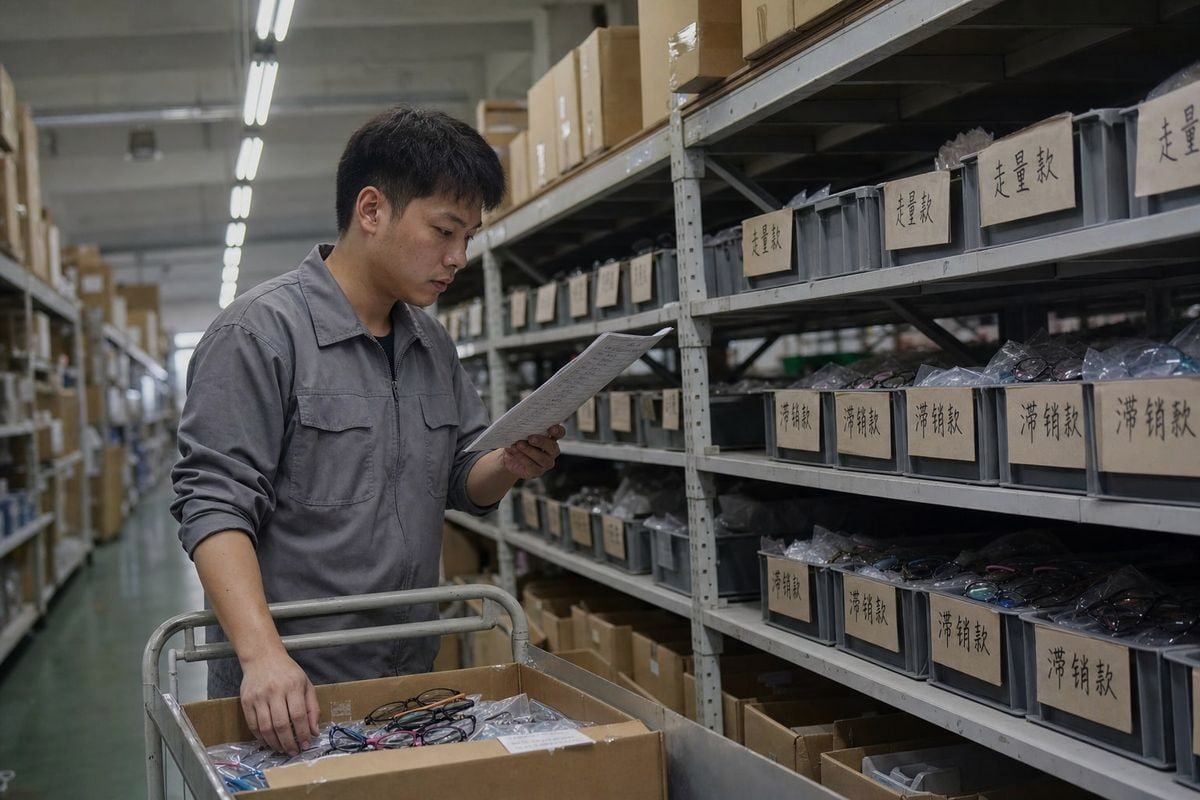
This is where a large existing-styles catalog becomes a genuine risk-management tool. Because our 800 designs already have molds, a brand can test five new styles with small quantities and no tooling investment. Sell-through data tells you which five to pick.
Build an attribute map, not a wish list
Start with your A-grade frames — the top 20% under ABC classification 8. Do not just note which styles won. Note why they won. Break each winner into attributes:
| Attribute | Example Winning Signal | Test Direction |
|---|---|---|
| Shape | Rounded rectangular outperforms angular | Test more rounded silhouettes |
| Material | TR90 + TPEE temples return less | Prioritize flexible constructions |
| Color | Translucent pastels beat solids for girls 6–10 | Add translucent blue, lilac |
| Größe | 46–48mm eye sizes sell out first | Test adjacent sizes up and down |
| Price tier | Mid-tier beats premium in your market | Stay in the proven bracket |
| Fit | Standard bridge slips on some patients | Test low-bridge alternative fits |
Fill gaps, then forecast growth
Two gap types deserve priority. First, alternative fits. Low-bridge and adjustable-fit kids frames are underserved by standard lines, and features like silicone ear hooks and slip-resistant temple tips often show strong sell-through precisely because few competitors stock them. Second, growth-stage sizing. Look at the ages in your current pediatric patient base. Children outgrow frames on a schedule you can roughly predict, so stock the next size up before your patients need it. This is product lifecycle management applied to a customer who literally grows.
Test small, review quarterly, commit gradually
Order trial quantities, give each test style one full quarter that includes a peak period, then apply the same sell-through thresholds you use for your core board. Winners graduate to standard reorder status. Losers exit before they become dead stock. Over a year, this SKU rationalization loop quietly rebuilds your kids board around proven demand instead of guesswork.
Schlussfolgerung
Kids frames tie up cash fast when nobody watches the numbers. Sell-through rate data fixes that: reorder proven winners, tweak fixable laggards, cut true dead stock, and test new styles by evidence — with a manufacturing partner who reads the data alongside you.
Fußnoten
1. Authoritative Wikipedia definition for retail sell-through metrics. ↩︎
2. Background on the nylon-based polymer material used in flexible children’s eyewear. ↩︎
3. Background on the turnover metric used alongside sell-through for board-level analysis. ↩︎
4. US safety guidance relevant to durable hardware components used in children’s product design. ↩︎
5. WHO data on children’s vision needs supports discussion of pediatric eyewear demand patterns. ↩︎
<span id
Weitere Artikel, die Ihnen gefallen könnten
August 2026
Bio-Based vs Regular Cellulose Acetate: What's the Difference for Kids' Frames?

August 2026
How Recyclable Are Kids' Optical Frame Materials, and What Eco-Friendly Alternatives Exist?
August 2026
Bleichen Kinderbrillengestelle im Lager aus oder altern sie, und wie kontrolliert man die Lagerbedingungen?
Auf der Suche nach einem zuverlässigen Partner für Kinderbrillen?
Entdecken Sie über 800 sofort verfügbare Modelle und umfassenden OEM/ODM-Support, der auf Ihre Marke zugeschnitten ist.
Kontakt aufnehmen English
  Español de México
  Deutsch
  Français
  日本語
日本語  العربية
  Português do Brasil