How to Use Sales Data to Set Pack Ratios for Kids Sunglasses SKUs?
I have watched buyers order our kids sunglasses in even splits, then struggle with leftover slow colors ABC classification 1. Guessing pack ratios burns cash. Sales data fixes that, and I will show you how.
To use sales data to set pack ratios for kids sunglasses SKUs, calculate each SKU’s unit share from historical sales, adjust for seasonality, margin, and inventory turnover, then convert that adjusted mix into pack percentages — for example, 40% core colors, 30% bright shades, 20% themed styles, 10% test designs.
That is the short answer. Now let us walk through the process step by step, from reading your sales history to working with your factory on the final ratio.
How do I identify which kids sunglasses styles are actually selling well before setting pack ratios?
A distributor from Australia once told me his best seller was a pastel round frame. His data said otherwise. It was his sporty wraparound style, hidden inside bundle sales. Our team helped him unpack the numbers.
Identify true winners by pulling SKU-level unit sales over at least two matching seasons, spreading any multipack sales down to component SKUs, and ranking styles by sell-through rate — not revenue alone — since cheaper frames often sell far more units than premium ones.

Sales data can lie to you if you read it the wrong way. Before you trust any number, you need to know what "selling well" actually means for pack ratio decisions. In my fifteen years supplying children's eyewear, I have seen three common traps. First, buyers look at revenue instead of units. A premium polarized style at a high price point can top the revenue chart while a simple TR90 2 frame outsells it three to one in units. Pack ratios are built on units, so units come first. Second, buyers forget about packs and bundles. If you sold a two-pack with one sport shield and one round pastel frame, both SKUs earned half a sale each. You must spread pack sales down to each component SKU before ranking anything. Third, buyers ignore stockouts. A style that sold out in May did not stop selling because demand died. It stopped because you ran out.
Rank Styles With Sell-Through, Not Gut Feel
Sell-through rate 3 is simple: units sold divided by units received, over a set period. It tells you how fast a style actually moves. Combine it with an ABC classification 4 to sort your assortment.
| Class | Definition | Typical Action |
|---|---|---|
| A | Top ~20% of SKUs driving ~70–80% of unit sales | Anchor the pack ratio around these |
| B | Middle performers with steady but modest sales | Keep moderate share, watch trends |
| C | Slow movers with low sell-through | Reduce or cut from the ratio |
Watch for Phantom Stockouts
Cross-check your sales dips against inventory records. If a bright-lens wraparound style shows zero sales for three weeks, confirm whether it was on the shelf at all. True demand is often higher than recorded sales for popular kids styles, because they sell out first. When we review reorders with long-term customers, this check alone often changes the ratio for one or two SKUs.
What sales data should I track from my previous kids eyewear orders to plan next season's assortment?
Every January, our sales team sits down with returning buyers to review the past season's numbers before locking new orders. The buyers who bring clean, detailed data always end up with tighter, more profitable assortments.
Track unit sales by SKU, sell-through rate, gross margin per style, inventory turnover, return and breakage rates, stockout dates, and sales split by age band, frame color, lens type, and region — collected over at least two comparable seasons to smooth out one-off spikes.

Not all data is equally useful. Some metrics tell you what to buy. Others tell you what to avoid. I recommend building a simple tracking sheet with the fields below, updated after each selling season. It does not need fancy software. A spreadsheet works fine for most kids eyewear brands we supply.
| Datenpunkt | Why It Matters for Pack Ratios |
|---|---|
| Unit sales by SKU | The core input for calculating unit share |
| Sell-through rate | Shows speed of sale, exposes overbuys |
| Gross margin per SKU | Prevents ratios built on popular but unprofitable styles |
| Inventory turnover 5 | Flags styles that tie up cash on the shelf |
| Return / breakage rate | Certain colors and coatings scratch or break more; high rates erode margin |
| Stockout dates | Reveals suppressed demand for true winners |
| Age band split | Toddler, kids, and tween sizes sell in very different proportions |
| Regional split | Sunny coastal markets often skew toward sport shields and polarisierte Gläser 6 |
Clean the Data Before You Trust It
Before any calculation, tidy the dataset. Remove duplicate order lines. Normalize SKU names so "BLU-RND-KDS" and "Kids Round Blue" do not count as two products. Fill or flag missing periods. In our experience, buyers who skip this step often double-count bundle sales and inflate one or two SKUs badly.
Compare Like With Like
Kids sunglasses are strongly seasonal. Never compare a pre-summer month against an autumn month. Compare this May against last May. If you only have one season of history, treat your first pack ratio as a working draft, then refine it after the next cycle. We often suggest new brands start with a balanced ratio across our existing styles, precisely so their first season generates clean baseline data at low risk.
How do I balance best-selling frame colors and sizes within a single pack ratio?
Here is a trade-off I discuss with buyers almost weekly: if three core styles drive 60% of your unit sales, should the pack ratio mirror that concentration, or protect variety? The honest answer is both, in measured doses.
Balance a pack ratio by giving core best-selling colors and sizes roughly their historical unit share, capping any single SKU below 40%, reserving 10–15% for trend or test styles, and adjusting shares up or down based on margin, turnover, and age-band coverage.

Your sales mix is history. Your pack ratio is a forward-looking bet. The mistake is copying one into the other without adjustment. A style may have sold heavily simply because you overstocked it or promoted it. Another may have underperformed because it launched late in the season. So treat unit share as the starting point, then apply deliberate adjustments.
A Worked Example
Say you sold 1,000 units last season across four style groups. Here is how raw share converts into an adjusted ratio:
| Style Group | Units Sold | Raw Share | Adjustment | Final Pack Ratio |
|---|---|---|---|---|
| Black sport wraparound shields | 380 | 38% | Strong margin, keep | 38% |
| Pastel two-tone round frames | 290 | 29% | High turnover, slight boost | 30% |
| Bright mirrored-lens sport styles | 210 | 21% | Higher breakage returns, trim | 18% |
| New / test styles | 120 | 12% | Protect testing space | 14% |
Notice the logic. The mirrored gradient-lens styles sold well, but if a coating shows more scratch returns, its share drops slightly. Test styles get a small bump because next season's winner has to come from somewhere. When we develop new colorways — say, a periwinkle-and-mint round frame in soft-touch TPEE — we always advise buyers to slot them into that test allocation rather than gamble a large share.
Do Not Forget Sizes and Age Bands
Colors get all the attention, but size ratios sink more assortments. Split your data by toddler, kids, and tween bands. A wraparound sport shield that fits an eight-year-old will not suit a three-year-old. If tween sizes are only 15% of your unit sales, do not let them creep to 30% of the pack because the styles look exciting. Flexible TR90 frames with TPEE temples forgive some fit variance, but they do not erase age-band demand patterns.
Can my eyewear manufacturer help me adjust pack ratios based on real sales performance?
A Japanese kids brand we supply sends us their sell-through report every September. By October, we have reshaped their spring order together — shifting colors, resizing packs, swapping two slow styles for fresh ones from our catalog. That collaboration is normal for us, and it should be for your supplier too.
Yes — a capable eyewear manufacturer can adjust pack ratios between orders by changing color assortments, resizing carton packs, swapping underperforming styles for proven catalog alternatives, and flexing production quantities per SKU, provided you share sell-through data and plan changes ahead of lead times.
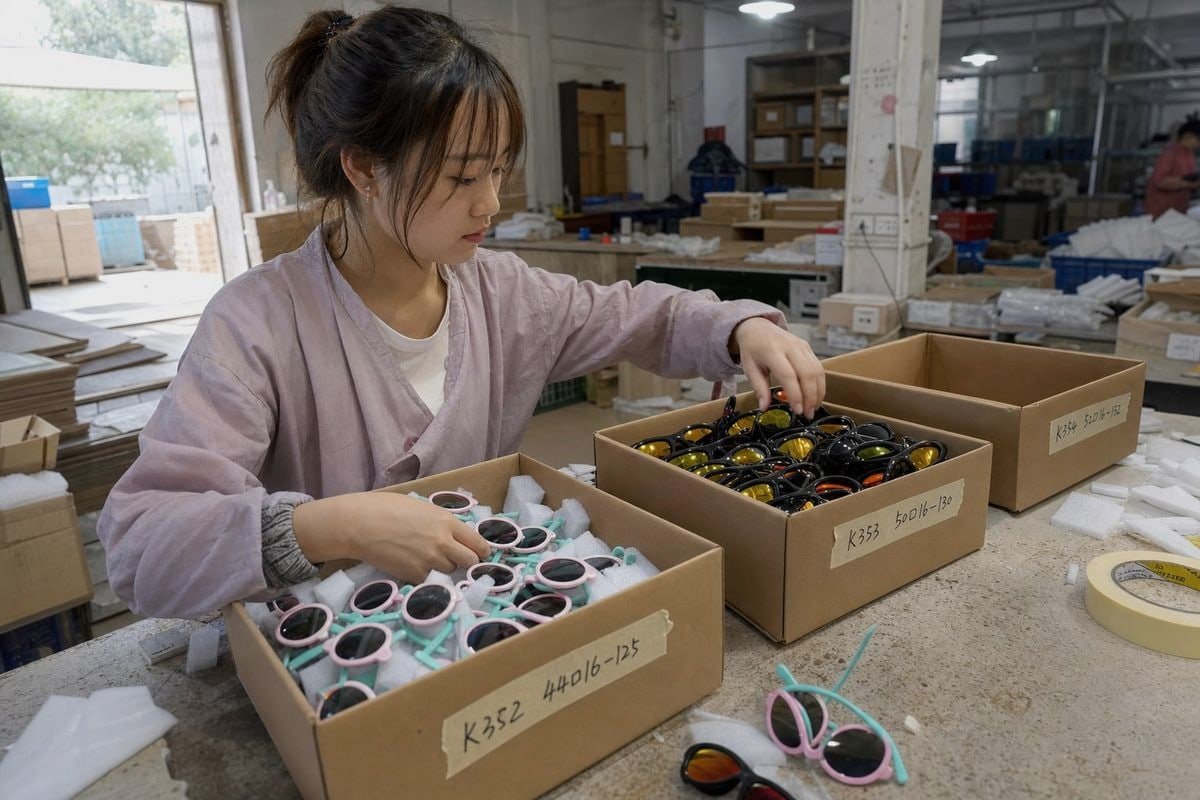
A good factory partner is not just a price on a quote sheet supply chain 7. It is a second set of eyes on your assortment. At our Taizhou facility, we produce children's eyewear for brands across more than twenty countries, and that gives us pattern recognition a single brand cannot build alone. When a buyer's data shows a pastel round frame slowing down, we can often tell them whether similar buyers in comparable markets saw the same shift — and which replacement styles moved instead.
What a Factory Can Realistically Adjust
There are practical limits, so it helps to know what is easy and what is not. Changing the color split within an existing style is simple. Swapping a slow style for another from a large existing catalog is also low-friction — with roughly 800 ready styles, our buyers can replace an underperformer without paying for a new mold. Custom pack configurations, inner-carton ratios, and retail-ready packaging can all be rebuilt around your new ratio. What takes longer is anything involving new tooling, new lens coatings, or fresh safety testing, so flag those changes early.
Make the Feedback Loop a Habit
Treat pack ratio adjustment as a rhythm, not a one-off fix. A simple cycle works well: share your season-end sell-through report, review the ratio together, adjust the next purchase order, then measure again. Buyers who run this loop every season steadily reduce their leftover stock while keeping shelves full of the styles kids actually pick up. The manufacturer's role is to make each adjustment cheap and fast to execute — flexible minimums per colorway, quick sampling of replacement styles, and honest input when a requested ratio looks risky based on what we see across markets.
Schlussfolgerung
Guesswork ratios leave money in dead stock. Sales data — cleaned, seasonalized, and margin-checked — turns your pack ratio into a repeatable system. Review it every season, and let your factory help you execute each adjustment.
Fußnoten
1. ABC classification is a standard inventory analysis method worth linking for reader context. ↩︎
2. Background on the thermoplastic material used for flexible kids eyewear frames. ↩︎
3. Defines the core retail metric used throughout the article for ranking SKUs. ↩︎
4. Explains the inventory categorization method referenced for sorting SKU performance. ↩︎
5. Wikipedia background on the financial metric used to flag slow-moving stock. ↩︎
6. Explains the optical technology behind polarized lens styles mentioned in demand data. ↩︎
7. WTO resource on supply chain collaboration relevant to manufacturer-buyer coordination discussed. ↩︎
Weitere Artikel, die Ihnen gefallen könnten

August 2026
Sollte die Fabrik die Verpackung und Kennzeichnung von Kinder-Sonnenbrillen übernehmen oder einen bestimmten Lieferanten nutzen?

August 2026
Eigenes Lager vs. Direktlieferung durch den Lieferanten: Was senkt die Retourenkosten für Marken von Kinder-Sonnenbrillen?

August 2026
Direkt zum Lagerhafen oder Lagerung in Übersee: Was spart mehr bei den Versandkosten für Kinder-Sonnenbrillen?
Auf der Suche nach einem zuverlässigen Partner für Kinderbrillen?
Entdecken Sie über 800 sofort verfügbare Modelle und umfassenden OEM/ODM-Support, der auf Ihre Marke zugeschnitten ist.
Kontakt aufnehmen English
  Español de México
  Deutsch
  Français
  日本語
日本語  العربية
  Português do Brasil