How to Use CTR and Add-to-Cart Data to Reorder Kids Sunglasses Colors?

Using CTR and add-to-cart data to reorder kids sunglasses colors sounds simple, yet on our production line we see brands reorder the wrong shades every season.
To reorder kids sunglasses colors with CTR and add-to-cart data, track both metrics per color variant, then prioritize colors that score above median on both. CTR shows which colors get noticed; add-to-cart rate reveals true purchase intent and deserves more weight in reorder decisions.
That is the short answer. The rest of this article shows you how to build that system step by step, and how to turn the numbers into a real purchase order.
What Does a Low CTR on a Kids Sunglasses Color Actually Tell Me?
Last spring, a European buyer told me their mint-teal round frame "wasn't working" because clicks were low. We dug into the data together and found a very different story.
A low CTR on a kids sunglasses color means the thumbnail or swatch fails to attract attention — nothing more. It does not prove low demand. Poor photography, bad swatch position, or weak contrast on mobile screens can suppress clicks on colors that would convert well if seen.

CTR is a visibility metric, not a demand metric. It equals clicks divided by impressions. So a low number tells you shoppers saw the color option but did not click it. Before you cut a color from your inventory replenishment strategy, you need to ask why the click never happened.
In our experience exporting to 20-plus countries, three causes explain most low-CTR colors. First, the image. A soft periwinkle-blue frame with mint-teal temples looks charming in hand, but on a white background with flat lighting, it washes out. Second, the position. On product pages with many variants, the default swatch order captures most first clicks. A color buried in position seven may never get a fair chance. Third, device context. Mobile screens compress swatches, and subtle two-tone colorways lose their appeal at small sizes.
The Four-Quadrant Color Matrix
The smarter move is to read CTR alongside add-to-cart rate 1. This matrix is the core of customer behavior analytics at the color level:
| CTR | Add-to-Cart Rate | What It Means | Action |
|---|---|---|---|
| High | High | Hero color | Reorder aggressively, place first |
| High | Low | Attention magnet, weak intent | Fix photos, pricing, or description |
| Low | High | Underexposed winner | Move up in swatch order |
| Low | Low | True underperformer | Deprioritize or retest with new imagery |
The "low CTR, high add-to-cart" quadrant is the one most brands miss. Those colors are quietly profitable. They deserve better placement before you decide their fate. That buyer's mint-teal frame? It sat in exactly that quadrant. We moved it to position two on their collection page, and it became a steady repeat-order SKU.
Which Add-to-Cart Metrics Should I Trust When Ranking My Best-Selling Colors?
One trade-off we weigh constantly when advising brand clients: raw add-to-cart counts flatter high-traffic colors, while rates flatter low-traffic ones. Neither alone tells the truth.
Trust session-based add-to-cart rate — sessions with an add-to-cart divided by total sessions — tied to the specific color variant. It is a stronger purchase intent signal than button-click counts, which inflate numbers when one shopper clicks repeatedly or adds multiple quantities.

Not all add-to-cart numbers are equal. Before you rank your product variant popularity, you need to know exactly what your analytics stack is counting. Here is how the common metrics compare:
| Metric | How It's Counted | Reliability for Reordering |
|---|---|---|
| Session-based ATC rate | Sessions with ≥1 add-to-cart ÷ total sessions | High — best intent proxy |
| Button-click ATC events | Every click on the add-to-cart button | Medium — inflated by repeat clicks |
| ATC-to-CTR ratio | ATC rate ÷ CTR per color | High — separates staples from viral colors |
| Raw ATC count | Total add-to-cart actions | Low — biased toward high-traffic colors |
Tie Events to the Selected Variant
The single most common tracking mistake we see is add-to-cart events that fire without capturing which color was selected. In GA4, use item ID and item name 2 dimensions so every event maps to a specific SKU. Without SKU-level performance analysis 3, you are guessing. When one of our clients built variant-level tracking for a sport wraparound style, they discovered the orange-mirror lens on the black frame outperformed the same lens on white — a distinction their old category-level data completely hid.
Benchmark With Context
Industry sources place healthy add-to-cart rates around 4–7%, with some stores reaching 10%. Use that range loosely. A color beating your own store median matters more than any external benchmark. Also compute the intent-to-interest ratio (ATC ÷ CTR) for each color. High-ratio colors are your dependable staples. Low-ratio colors attract eyes in the e-commerce sales funnel but leak intent — often a photo-versus-reality mismatch.
How Do I Turn My Sales Data Into a Reorder Plan With My Manufacturer?
A procurement manager from Australia once sent us a spreadsheet with nothing but last month's unit sales. We asked for her CTR and add-to-cart data too — and the reorder mix changed completely.
Convert color-level CTR and add-to-cart rates into a weighted demand score, then adjust quantities for lead time, MOQ, and seasonality. Share this SKU-level forecast with your manufacturer early so hero colors get priority scheduling and safety stock before peak season.
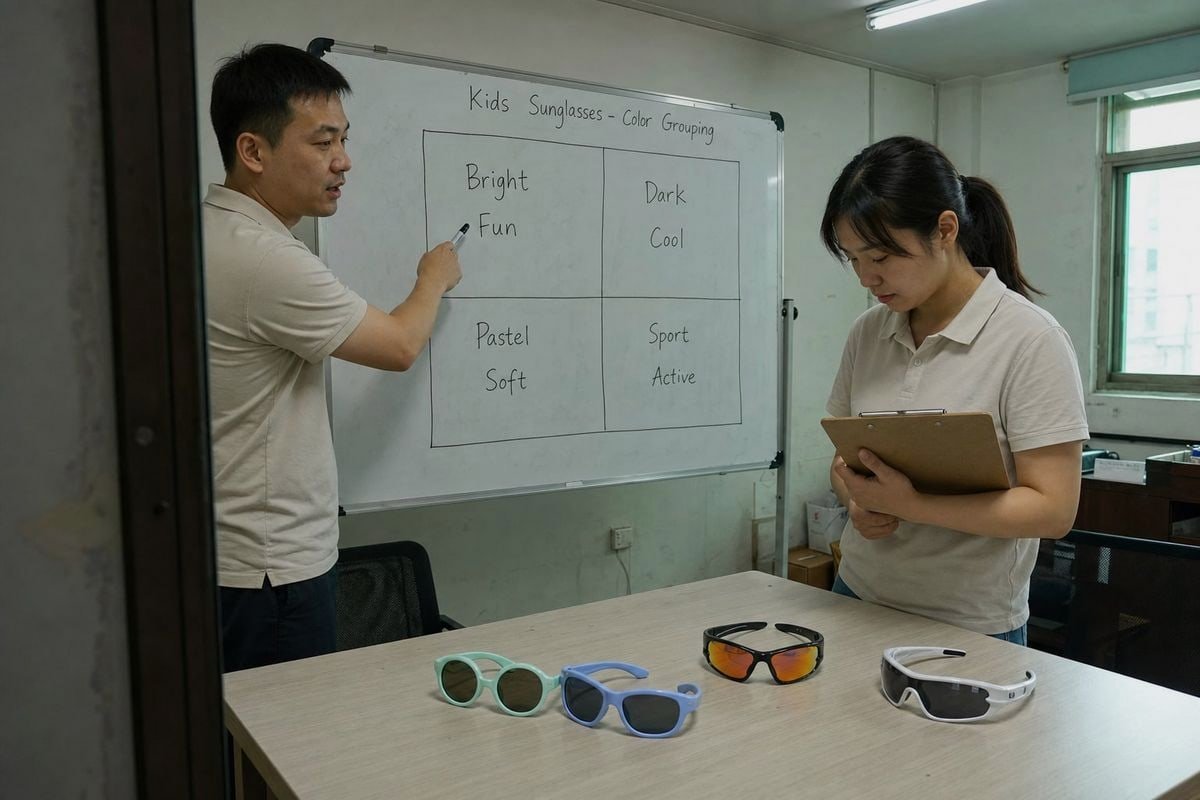
Behavioral data only creates value when it survives contact with production reality. At our Taizhou factory, we run a 5S-managed workshop 4 with around 120 workers, and even so, lead times and minimum order quantities 5 shape what a data-driven reorder can actually look like. Here is the workflow we recommend to the brands we supply.
A Five-Step Reorder Workflow
- Score each color. Combine CTR and add-to-cart rate into one weighted score. We suggest weighting add-to-cart at roughly twice the value of CTR, since it sits closer to purchase in the funnel.
- Layer in shadow demand. Colors that sold out early carry hidden demand. Check out-of-stock page CTR and waitlist sign-ups to quantify lost sales, then inflate those reorder quantities.
- Apply seasonal decay. Trendy shades — think mirrored orange-to-yellow gradient lenses — drop faster post-peak than evergreen black or navy. Your demand forecasting models should discount trend colors for late-season orders.
- Match quantities to MOQ and lead time. High-velocity colors need earlier reorder triggers for stockout prevention. Slow colors can ride the standard cycle.
- Share the data with your factory. When buyers send us variant-level scores, we can prioritize color batches, plan lens coating runs, and hold safety stock on TPEE temple colors.
| Reorder Input | Source | Effect on Order Quantity |
|---|---|---|
| Weighted CTR + ATC score | Analytics | Sets base ranking |
| Shadow demand (waitlists, OOS clicks) | Store data | Increases sold-out colors |
| Seasonal decay factor | Historical trends | Reduces trend shades late-season |
| MOQ and lead time | Manufacturer | Rounds and times the order |
| Inventory turnover ratio 6 | Finance | Caps slow-moving colors |
A healthy inventory turnover ratio keeps cash free for the colors that earn it. This kind of predictive analytics for retail does not need enterprise software — a disciplined spreadsheet and an open line to your supplier will get you most of the way.
Can I Test New Colorways Before Committing to a Full Production Run?
The lesson that reshaped how we advise clients came from a failed gradient-lens launch years ago: the brand ordered five colorways blind, and only two sold. Testing first would have saved them.
Yes. Test new colorways using existing catalog styles, small pilot orders, pre-order pages, or digital-only listings before full production. Measure CTR and add-to-cart rate per color for four to six weeks, then commit volume only to validated winners.
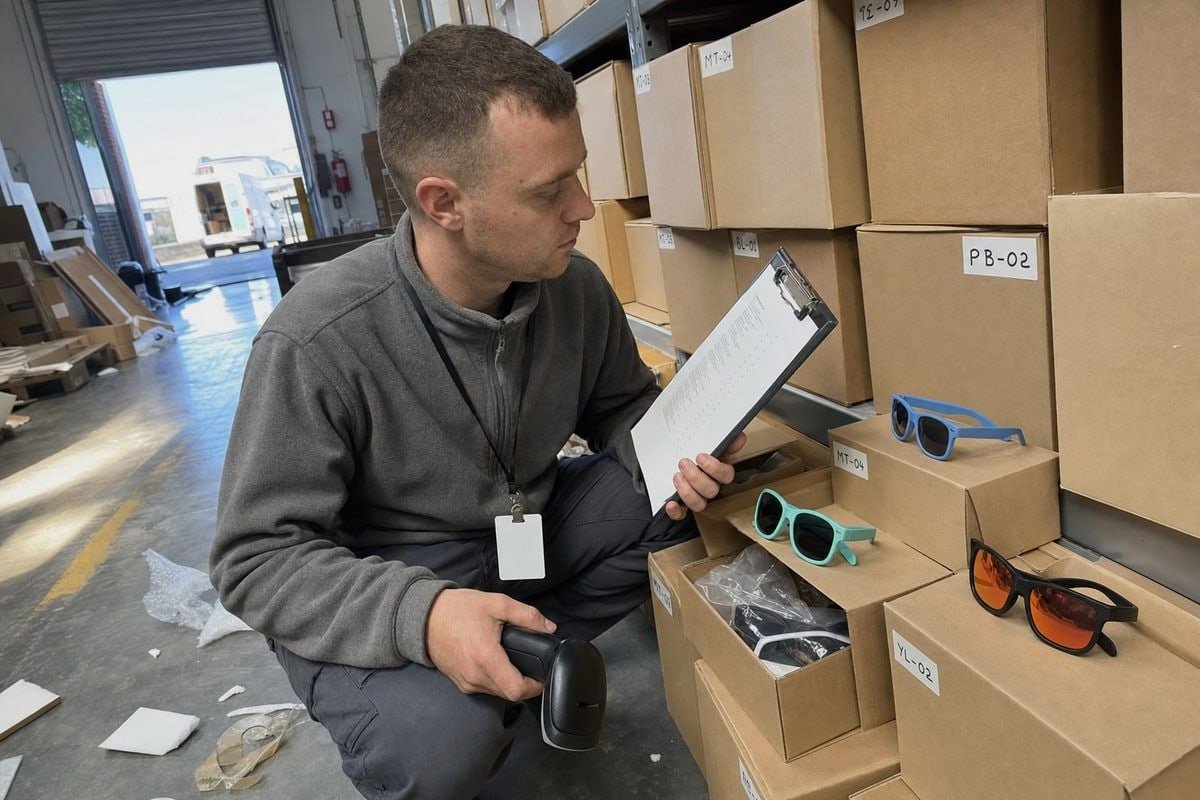
You do not need to gamble a full production run on an unproven shade. There are several low-risk paths, and they suit different situations.
Four Ways to Validate a Colorway
Start with existing styles. This is the fastest route. Our catalog holds roughly 800 existing styles, which means a new brand can pick a periwinkle-and-mint two-tone or a white-frame wraparound with an iridescent shield lens without paying for new molds. You test real market response at low risk, then invest in custom colors once the data supports it.
Run a digital test first. List the new colorway with rendered images or a small photo sample before mass production. Track CTR on the swatch and add-to-cart rate on the variant. If both clear your store medians within four to six weeks, you have a purchase intent signal worth acting on.
Use pre-orders as a demand probe. A pre-order page converts interest into commitment. It also builds a waitlist you can use as shadow demand data for your first real order.
Pilot a small batch. For OEM clients 7, we often run a reduced first batch on a new custom color — enough units to stock the store and gather clean behavioral data, small enough to limit downside. Because our TPEE and TR90 materials run on shared tooling across colorways, adding a validated color to the next full run is straightforward.
One caution from experience: segment your test results. Parents buy, but children influence. A bold mirrored lens may win clicks from kids browsing beside a parent on mobile, while muted tones win desktop add-to-carts from parents shopping alone. Test by device and audience before declaring one universal winner.
Conclusion
Arbitrary color ordering quietly costs sales every day. The fix is simple discipline: measure CTR and add-to-cart per color, rank by intent, and reorder with your factory using real data.
Footnotes
1. Official e-commerce platform docs explain how conversion and cart metrics are tracked and interpreted. ↩︎
2. Google’s official GA4 documentation details these dimensions for variant-level event tracking. ↩︎
3. Wikipedia explains SKU concepts underlying variant-level tracking discussed in the article. ↩︎
4. Wikipedia explains the 5S workplace organization methodology referenced for the factory setup. ↩︎
5. International Trade Centre provides authoritative guidance on MOQ practices in global manufacturing. ↩︎
6. Wikipedia defines this financial metric used to guide reorder and stock decisions. ↩︎
7. Alibaba.com is a leading B2B sourcing platform relevant to OEM manufacturing relationships described. ↩︎
More Articles You Might Like

August 1, 2026
Should Factory Handle Kids Sunglasses Packaging & Labeling, or Use a Designated Supplier?

August 1, 2026
Own Warehouse vs Supplier Direct Fulfillment: Which Cuts Return Costs for Kids Sunglasses Brands?

August 1, 2026
Direct-to-Port Warehouse or Overseas Staging: Which Saves More on Kids Sunglasses Shipping?
Looking for a Reliable Kids Eyewear Partner?
Explore 800+ ready styles and full OEM/ODM support tailored to your brand.
Get in Touch English
  Español de México
  Deutsch
  Français
  日本語
日本語  العربية
  Português do Brasil