How Should Return Rates Affect Order Quantities for Kids Optical Frames?
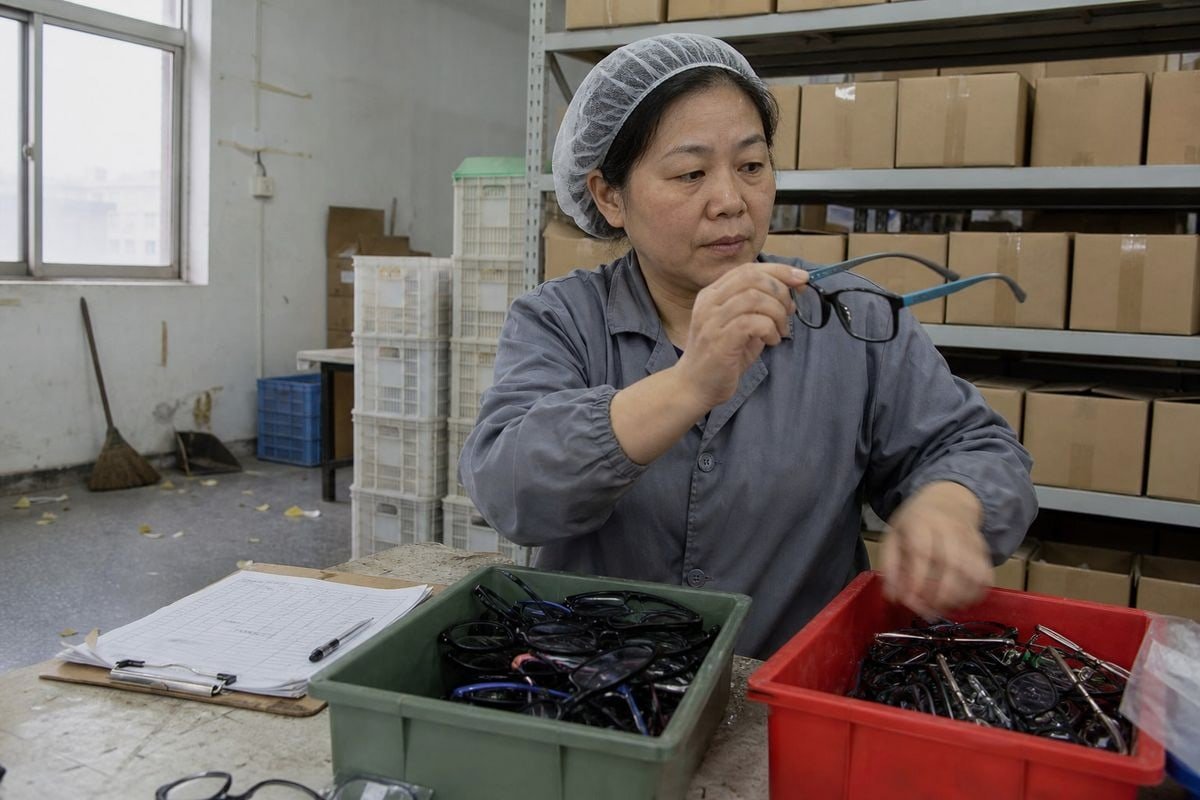
Return rates and order quantities for kids optical frames 1 are tightly linked, and I see buyers get this wrong every season. Returns quietly eat the margin your sell-through numbers promised. Our factory data shows a smarter way.
Return rates should lower order quantities for kids optical frames, but not by a flat percentage. Buyers should model net demand — expected sales minus non-resalable returns — then cut orders only on SKUs with persistently high returns, while fixing fit, durability, and assortment causes first.
That answer sounds simple. In practice, it takes a few calculations and some honest data. Let me walk you through each step the way we do it with our own B2B buyers.
How can I calculate the right order quantity if my return rate is higher than expected?
A buyer from Australia once sent me a spreadsheet showing 18% returns on one pediatric frame style. Her instinct was to cut every kids' order by 18%. Our team ran the numbers with her, and the real adjustment looked very different.
Calculate net demand first: expected sales minus expected returns, then add back the share of returns you can resell as new. Order to cover net demand plus safety stock. Only reduce quantities on the specific SKUs driving the high return rate, not the whole category.

The math starts with a clear definition. In optical retail, return rate is usually returned frames divided by frames ordered or frames sold. Twenty returns out of 100 ordered means a 20% return rate. Pick one definition and stick with it, because mixing the two distorts your demand forecasting.
The net-demand formula in plain steps
- Take expected gross sales for the SKU over your order cycle.
- Multiply by the historical return rate for that SKU.
- Split those returns into resalable and non-resalable units.
- Net demand 2 = gross sales − returns + resalable returns.
- Add safety stock 3 for stockout prevention, based on lead time and demand variability.
- Compare the result against your Economic Order Quantity (EOQ) 4 so ordering costs and carrying costs stay balanced.
Here is a worked example for one kids' frame style:
| Input | Value |
|---|---|
| Expected gross sales (per cycle) | 100 units |
| Return rate | 15% |
| Returns that are resalable as new | 60% |
| Net keepers | 85 units |
| Resalable units back in stock | 9 units |
| Base order need | 91 units |
| Safety stock (lead time buffer) | +12 units |
| Suggested order | 103 units |
Notice the order barely drops. Supply-chain research 5 supports this: when returns are resalable, the optimal order quantity adjusts downward only modestly, and profit curves are fairly flat near the optimum. The danger is overreacting to one noisy month and understocking a strong seller. In our experience, we tell buyers to wait for at least two or three order cycles of stable return data before cutting a core style. Also remember timing: returns that come back fast can be resold in season; slow reverse logistics turns the same frame into slow-moving inventory.
What return rate is considered normal for kids optical frames in my market?
When we review post-season feedback with importers across 20+ countries, one pattern repeats: buyers judge their returns against adult-frame benchmarks, then panic. Kids' frames play by different rules, and the "normal" range shifts by channel and market.
There is no single universal benchmark, but kids optical frames typically return more often than adult frames because of fit sensitivity, rapid growth, and parent-child style mismatch. Judge each SKU against your own category average rather than a generic retail number.
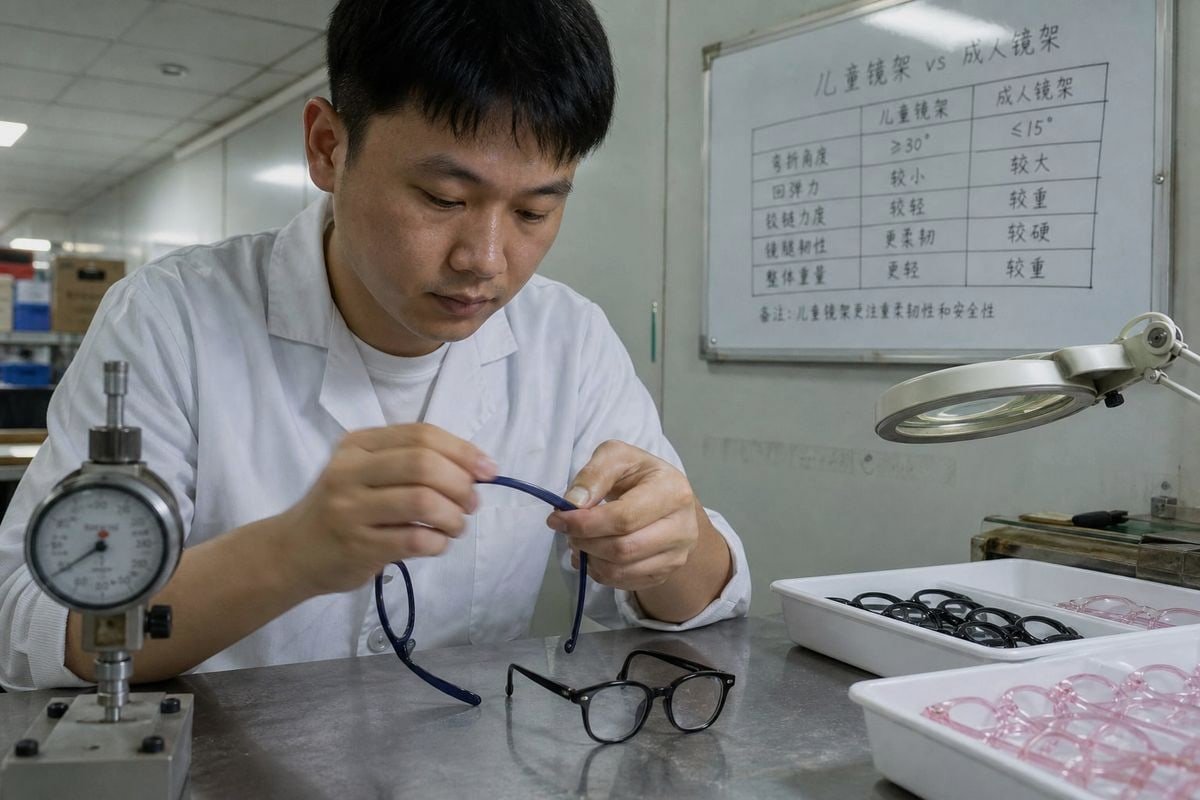
The honest answer is that the kids eyewear market has no published, reliable kids-specific return statistic. What the industry does agree on is the direction: children's frames carry higher return risk than adult frames. The drivers are structural, not random.
Why kids' frames return more than adult frames
Children grow quickly, so a frame fitted in spring can pinch by autumn. Bridge fit on small noses is unforgiving. Parents choose durability while kids choose color, and the loser of that negotiation often returns the frame. Add school and playground wear-and-tear, and frame durability becomes a return driver in a way it rarely is for adults.
| Return driver | Adult frames | Kids optical frames |
|---|---|---|
| Fit sensitivity | Moderate | High — small bridges, growing heads |
| Growth-related refits | Rare | Common within 6–12 months |
| Breakage in use | Low | High without flexible materials |
| Style mismatch | Buyer decides alone | Parent-child conflict raises risk |
| Activity damage | Occasional | Frequent — sports, school, play |
This is why we build most of our children's styles in TR90 with TPEE temples 7. Flexible material absorbs the twisting and sitting-on that rigid acetate cannot. On styles like our black-and-navy frame with silicone cable ear hooks, the bendable temple tips exist precisely to cut fit-related and breakage-related returns.
So how should you set your own benchmark? Track return rate by model, size, and color within your assortment. Compare each SKU to your kids-category average, not to your store total. A frame running two or three times above your category norm has a product problem. A frame running at the norm reflects ordinary demand uncertainty, and cutting its order only creates stockouts and hurts your inventory turnover rate.
Should I order smaller batches first to reduce my risk of high returns?
The trade-off we weigh most often with new brand clients is speed versus certainty. A big first order earns a better unit price. A small first order earns better data. After fifteen years running our Taizhou workshop, I almost always argue for the data.
Yes, for new or unproven styles. A split-order approach — roughly 60–70% upfront on proven core styles and 30–40% held for replenishment based on real sales and return data — reduces exposure to high returns without starving your best-sellers.
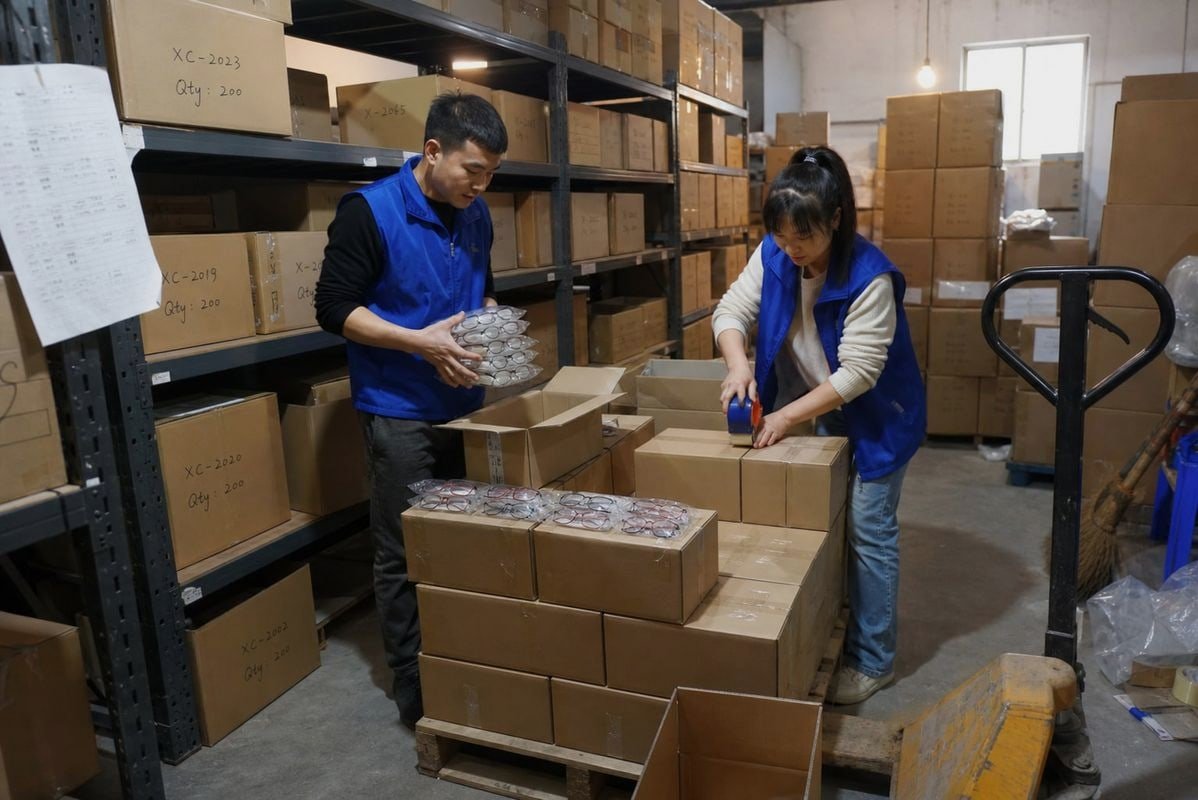
Smaller first batches work because kids' frame demand is hard to predict at the style level. A translucent pink cat-eye acetate frame might delight one market and sit untouched in another. Testing before committing protects you from both high returns and dead stock.
A practical split-order framework
| Order stage | Share of budget | What to buy | What you learn |
|---|---|---|---|
| Initial order | 60–70% | Proven core shapes, safe colors, larger safety stock on best-sellers | Baseline sell-through by size and color |
| Replenishment | 30–40% | Winners from real-time sales velocity; drop or shrink high-return SKUs | True return rate per SKU, resalability of returns |
This is also where a factory partner changes your risk profile. One reason we keep around 800 existing styles open to buyers is exactly this: a brand can test five or ten designs in modest quantities without investing in molds, then scale only the winners. That is supply chain optimization at the buying level, not just the shipping level.
Two cautions, though. First, do not split so small that you lose stockout prevention on your core styles — a best-seller out of stock costs more than a returned frame. Second, remember your reorder point math: average daily sales multiplied by total lead time, plus a safety buffer. Overseas production has real lead times, so your replenishment trigger must fire early enough. We help buyers plan this around our production calendar so the second batch lands before the first sells through.
There is a counter-argument worth addressing. Some buyers say: order a little extra and rely on supplier returns to clean up inventory later. That works only if your customer returns policy with the supplier credits current product at full value. Once you factor in shipping back, restocking deductions, and delayed credit, over-buying is usually the more expensive form of insurance.
How do I work with my manufacturer to lower return rates before increasing order size?
A lesson we learned early: buyers who share their return data with us get better products. Years ago, a European distributor kept quiet about temple breakage on a rigid style. Once they finally sent us the broken samples, we switched that model to TPEE temples — and their reorders doubled.
Share SKU-level return reasons with your manufacturer, then fix root causes together: switch to flexible TR90 and TPEE materials, adjust sizing for your market, tighten QC standards, and improve fitting information. Scale order quantities only after the corrected version proves a lower return rate.
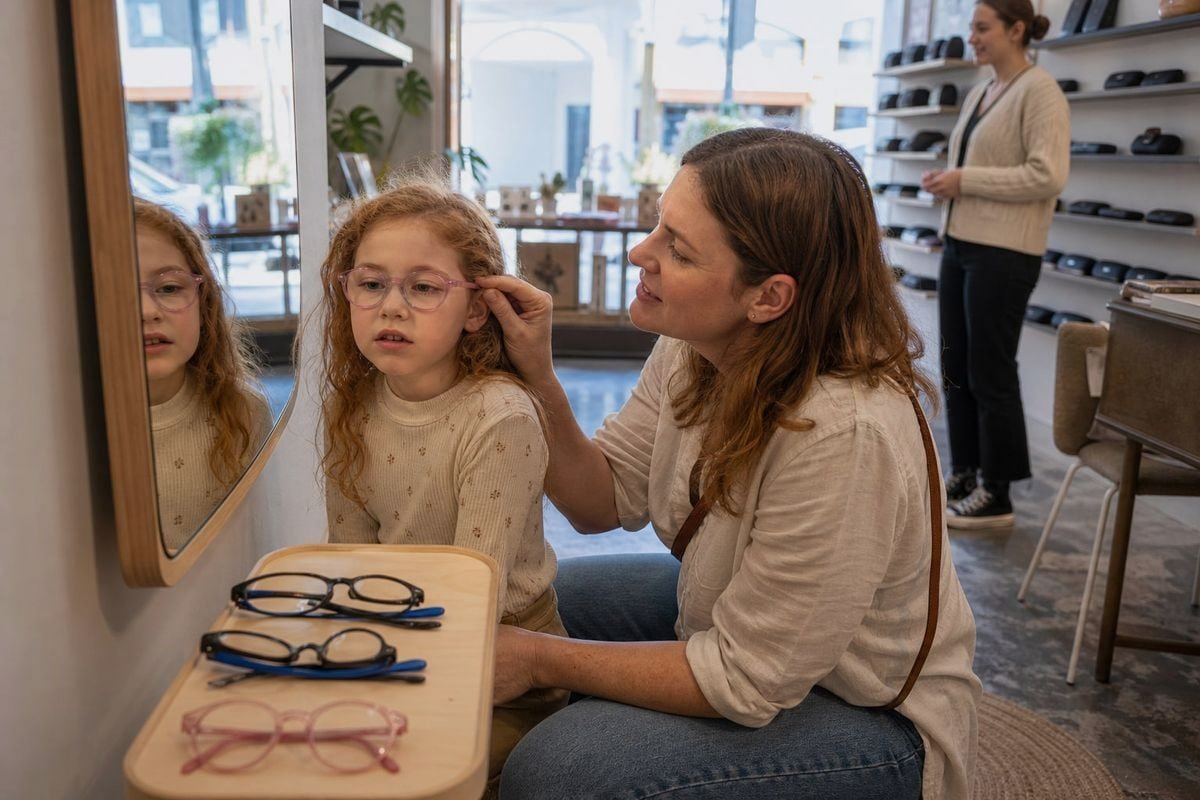
Most retailers treat returns as a retail problem. In our experience, a large share of kids' frame returns trace back to decisions made at the factory: material choice, hinge design, bridge width, temple length, and quality control tolerances. That means your manufacturer is your biggest lever — before you touch order quantities at all.
A step-by-step collaboration process
- Categorize your returns. Split them into fit-related, style-preference, defect or damage, and policy-driven exchanges. Each category has a different fix.
- Send physical samples of failed frames. Photos hide stress fractures and hinge wear. Our engineers learn far more from a broken temple in hand.
- Review materials together. If breakage drives returns, flexible TR90 fronts with TPEE temples and silicone tips dramatically outlast rigid plastics on active kids.
- Adjust sizing for your market. Bridge and temple dimensions that fit one region's face shapes can cause slippage returns elsewhere. Small OEM adjustments cost little.
- Tighten QC checkpoints. Agree on inspection standards for hinges, coatings, and lens seating before mass production. Our 5S-managed workshop runs these checks as standard, but the criteria should reflect your return data.
- Improve fit communication. Clear size specifications, accurate product descriptions, and good packaging inserts reduce "misleading description" returns before the frame ever ships back through reverse logistics.
Only after the corrected version ships should you increase batch size. Then account for the true cost per frame — unit price plus expected return and warranty costs, replacement shipping, and customer service time — when comparing suppliers. A slightly cheaper frame with double the return rate carries higher carrying costs and lower real margin. Looking ahead, better demand forecasting tools, personalized fit technology, and even refurbishment programs for outgrown frames will keep shrinking return losses, but the fastest gains today come from a factory partner who treats your return data as design input.
Conclusion
High returns quietly drain kids' frame profits. Don't just order less — model net demand, benchmark by SKU, test with split batches, and fix root causes with your factory. That's how we help buyers scale confidently.
Footnotes
1. Provides an overview and statistics of the children’s eyewear market. ↩︎
2. Defines the concept of net demand in a business context. ↩︎
3. HTTP 404 ↩︎
4. HTTP 403 ↩︎
5. Highlights authoritative organizations for supply chain management and research. ↩︎
6. Explains the Newsvendor model for inventory optimization under uncertainty. ↩︎
7. Describes the properties and benefits of TR90 and TPEE materials in eyewear. ↩︎
More Articles You Might Like

August 5, 2026
Bio-Based vs Regular Cellulose Acetate: What's the Difference for Kids' Frames?

August 5, 2026
How Recyclable Are Kids' Optical Frame Materials, and What Eco-Friendly Alternatives Exist?
August 5, 2026
Do Kids Optical Frames Whiten or Age in Storage, and How to Control Warehouse Conditions?
Looking for a Reliable Kids Eyewear Partner?
Explore 800+ ready styles and full OEM/ODM support tailored to your brand.
Get in Touch English
  Español de México
  Deutsch
  Français
  日本語
日本語  العربية
  Português do Brasil