How to Calculate Inventory Turnover Days for Kids Sunglasses to Optimize Order Quantity?

Every season, our factory sees buyers overorder kids sunglasses, tie up cash, then panic-discount in autumn. Knowing inventory turnover days would have prevented most of those painful markdowns.
To calculate inventory turnover days for kids sunglasses, divide your Cost of Goods Sold by average inventory to get the turnover ratio, then divide 365 by that ratio. The result shows how many days stock sits before selling, guiding your next order quantity.
Let me walk you through the exact formula, the target numbers to aim for, and how to turn this metric into smarter purchase orders.
How do I calculate inventory turnover days for kids sunglasses accurately?
Last spring, a buyer from Australia asked me why her cash was stuck despite good sales. We ran her numbers together, and the answer was hiding in one simple calculation.
Calculate average inventory as beginning inventory plus ending inventory divided by two. Divide Cost of Goods Sold by that average to get your Inventory Turnover Ratio. Then divide 365 by the ratio. The result is your inventory turnover days for kids sunglasses.
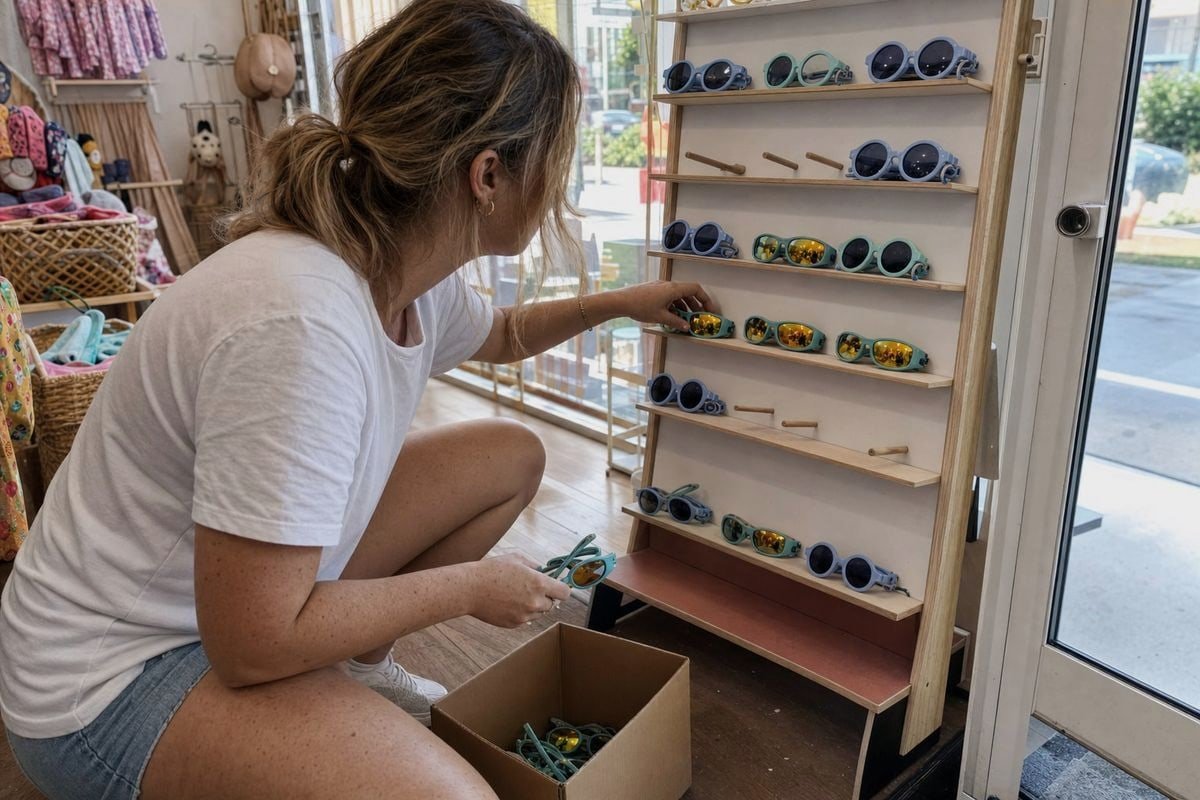
The math is simple, but accuracy depends on using the right inputs. Let me break it down step by step.
The three-step formula
First, find your Average Inventory Value 1. Take the inventory value at the start of the period, add the value at the end, and divide by two. This smooths out the seasonal spikes that are normal in the eyewear business.
Second, compute your Inventory Turnover Ratio 2. Divide your Cost of Goods Sold for the period by the average inventory. Always use cost values on both sides. Do not mix retail selling prices 3 with cost figures. That is the most common error I see in buyer spreadsheets.
Third, convert the ratio to days. Divide 365 by the turnover ratio for an annual view. For a quarterly view, use 90 or 91 days instead.
A worked example with real numbers
Here is an example based on figures a typical importer of our kids sunglasses might see.
| Step | Input | Value |
|---|---|---|
| Beginning inventory | Stock value on Jan 1 | $18,000 |
| Ending inventory | Stock value on Dec 31 | $22,000 |
| Average inventory | ($18,000 + $22,000) ÷ 2 | $20,000 |
| Annual COGS | Cost of sunglasses sold | $120,000 |
| Turnover ratio | $120,000 ÷ $20,000 | 6 turns |
| Turnover days | 365 ÷ 6 | ~61 days |
So each pair sits in stock about 61 days on average. The equivalent shortcut formula is (Average Inventory ÷ COGS) × 365, which gives the same answer.
Common mistakes to avoid
Do not use ending inventory alone. A December snapshot after holiday sell-through will make your turnover look far better than it really is. Also, calculate the metric per SKU group, not just for the whole store. A fast-selling round two-tone frame and a slow novelty style can hide each other's performance inside one blended number. Finally, account for shrink, breakage, and returns. Kids products break more often than adult eyewear, so damaged units inflate your inventory value if you never write them off.
What inventory turnover rate should I target when ordering kids sunglasses from a factory?
One trade-off we discuss constantly with new brand clients is speed versus availability. Turning stock fast frees cash, but running too lean during July means empty shelves at peak demand.
For kids sunglasses, most healthy retailers target 2 to 6 inventory turns per year, which equals roughly 60 to 180 inventory days. Seasonal sellers should aim for the faster end during summer, while year-round optical channels can accept slower turns.
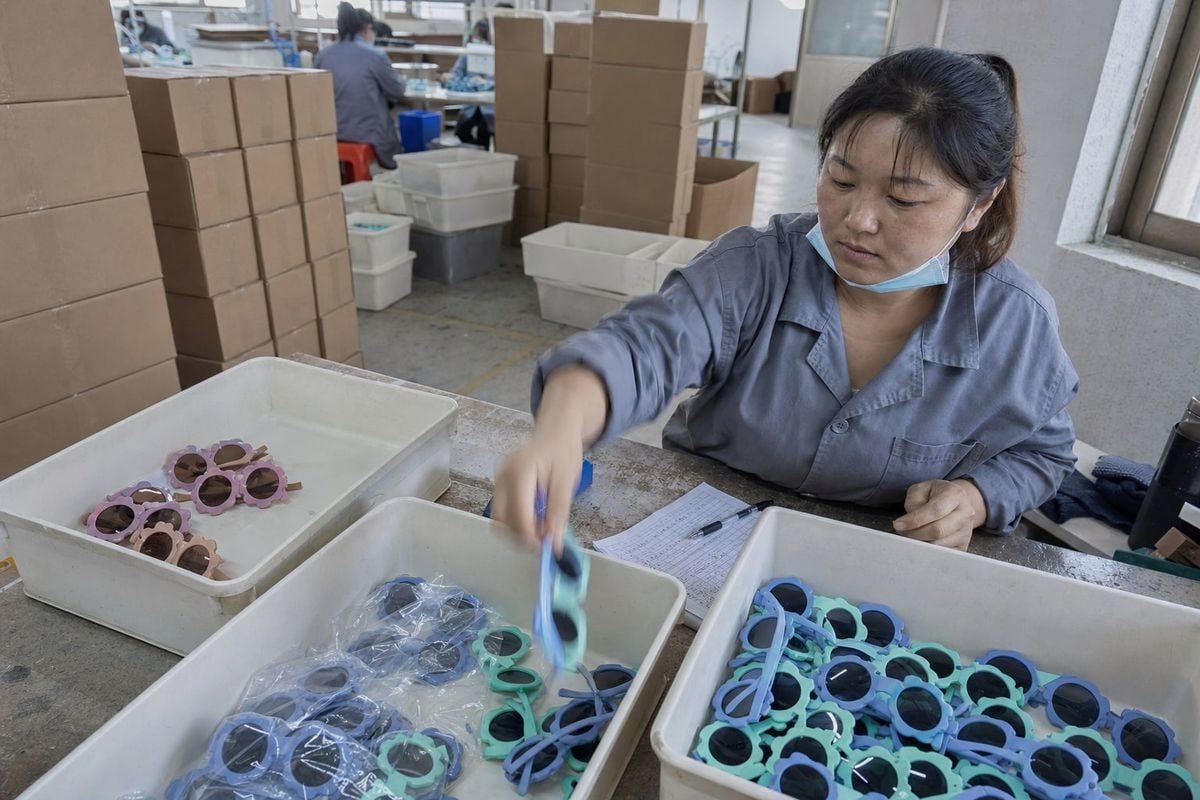
There is no single magic number, and I want to be honest about that. Benchmarks found online often quote 2 to 4 turns per year for eyewear, giving 90 to 180 days. That range works for optical stores with stable, year-round demand. But kids sunglasses behave differently. Demand shifts from fashion-driven spring purchases to utility-driven summer purchases, then falls sharply. A single annual target hides that curve.
Benchmark against your own reality, not a universal number
Instead of chasing one industry figure, compare your turnover days against factors you actually control.
| Benchmark factor | What to compare | Why it matters |
|---|---|---|
| Last season's performance | Same SKUs, same months | Shows real improvement or decline |
| Supplier lead time | Production plus shipping days | Turnover days shorter than lead time means Stockout Risk |
| Season length | Weeks of peak selling | Stock must clear before demand drops |
| Carrying Costs | Storage, insurance, capital cost | Long turnover days quietly eat margin |
| Markdown tolerance | Discount depth you can absorb | Slow movers become forced clearance |
Adjust the target by channel and demographic
Our export experience across 20+ countries shows channels behave very differently. Beach shops and gift retailers may turn kids sunglasses 6 to 8 times in a compressed season. E-commerce brands with steady traffic often sit around 4 to 5 turns. Optical companies stocking our TR90 kids optical frames alongside sunglasses may run 2 to 3 turns and still be healthy, because frames sell year-round.
Also segment by age bracket. Toddler sizes, kids sizes, and pre-teen sport shields like our wraparound mirrored-lens styles each move at their own velocity. Calculating one blended ratio across all of them will mislead your Seasonal Demand Forecasting. Track them separately, and you will see clearly which demographic drives your fastest turns.
How can I use turnover days to decide my next order quantity and avoid overstocking?
A lesson I learned early in our fifteen years of eyewear production: buyers rarely get burned by the formula itself. They get burned by ignoring what the number tells them to order next.
Convert turnover days into daily unit sales, then order enough to cover your supplier lead time plus safety stock, minus stock on hand. Reorder fast movers in smaller frequent batches, and cut future quantities on any SKU whose turnover days keep climbing.

Turnover days become powerful when you connect them to three other numbers: your lead time, your Safety Stock Levels 5, and your remaining season length. Here is the practical process I walk clients through.
A five-step reorder process
- Convert to daily demand. If you sold 2,400 units of a style in 120 selling days, daily demand is 20 units.
- Set your Reorder Point. Multiply daily demand by lead time, then add safety stock. With a 30-day lead time and 15 days of safety stock, your reorder point is 20 × 45 = 900 units.
- Check season runway. If only 50 selling days remain, do not order more than about 50 days of demand. Stock arriving after the season ends becomes next year's carrying cost.
- Segment SKUs by velocity. Fast movers get frequent small reorders. Slow movers get reduced or cancelled orders, bundling, or early discounts.
- Recalculate monthly, or weekly during peak season. Turnover days shift fast in a seasonal category.
Match order behavior to SKU speed
| SKU segment | Turnover days | Ordering action |
|---|---|---|
| Fast movers | Under 45 days | Reorder often, smaller batches, protect against stockouts |
| Average movers | 45–90 days | Maintain moderate safety stock, review monthly |
| Slow movers | Over 90 days | Cut next order, bundle, discount, or drop the style |
Refinements specific to kids eyewear
Two adjustments matter in this category. First, apply a breakage-replacement buffer to safety stock. Children sit on, bend, and drop their sunglasses far more than adults do, so replacement purchases and warranty swaps add hidden demand. Our flexible TPEE temples reduce breakage, but the buffer still helps. Second, watch correlated adult styles. When a mirrored sport shield trends in adult sizes, the matching kids version often follows within weeks. That signal lets you reorder before the spike, which classic Economic Order Quantity 6 models based only on history will miss.
Good Lead Time Management 7 ties it all together. If your factory quotes 30 to 40 days production plus shipping, and your turnover days are 61, you are reordering with a comfortable but not lazy margin. If lead time exceeds turnover days, you must either order deeper or find a supplier who ships faster.
Why does choosing from ready-made styles help me shorten inventory turnover and reduce risk?
During a factory visit last year, a European baby-brand buyer told me her biggest fear was not price. It was committing to 5,000 units of a custom mold that might not sell. Our showroom changed her whole ordering strategy.
Ready-made styles remove mold investment and shrink lead times, so you can order smaller test quantities, reorder only proven winners, and keep turnover days low. Lower minimum order quantities mean less capital trapped in slow movers and far lower overstock risk.
Custom tooling is wonderful once a style is proven. But for a new brand or a new market, custom molds force you into large minimum orders before you have any sales data. That is precisely how turnover days blow out past 150 or 200, and how capital gets frozen in styles nobody wanted.
How ready-made styles change the turnover math
Our catalog holds around 800 existing kids eyewear styles, from soft two-tone round frames in flexible rubberized material to bold single-shield sport shapes with gradient mirrored lenses. When a buyer selects from these, three things happen to their inventory metrics.
First, MOQs drop. Without mold costs to amortize, we can accept smaller trial orders. A buyer can test five styles at modest quantities instead of betting everything on one design. High inventory days on any style become a cheap lesson, not a financial wound.
Second, lead times shorten. Tooling development can add six to eight weeks to a custom project. Existing styles skip that entirely. We only need production time for your chosen colors, UV400 or polarized lenses 8, logos, and packaging. Shorter lead time means you can hold leaner stock and still avoid stockouts, which directly reduces turnover days.
Third, reordering gets faster. Once your sales data identifies the winners, repeat orders of an existing style move through production quickly. You replenish in-season instead of guessing everything up front. This is the single biggest lever for a seasonal category like kids sunglasses.
Test small, then scale what sells
The pattern we recommend to new B2B partners is simple. Season one: pick a spread of ready-made styles, order conservatively, and track turnover days per SKU. Season two: double down on styles that turned in under 60 days, drop the laggards, and consider custom colorways or full OEM branding on the proven shapes. Your Inventory Turnover Ratio improves each cycle because every order is grounded in evidence, not hope. Flexible, safe materials like TPEE and TR90 also lower return rates from breakage, which keeps sellable inventory accurate and your turnover data clean.
Conclusion
Overstock drains cash; stockouts drain sales. Calculate turnover days, benchmark them against lead time and season length, then order by SKU velocity. Ready-made styles make the whole cycle safer.
Footnotes
1. Professional accounting guide on the methods used to assign costs to unsold inventory items. ↩︎
2. Official government definition of the financial ratio measuring how many times inventory is sold and replaced. ↩︎
3. Definition of the price at which a product is sold to the final consumer. ↩︎
4. IRS guidance on calculating the direct costs attributable to the production of goods sold. ↩︎
5. Overview of the extra stock maintained to mitigate the risk of stockouts due to demand fluctuations. ↩︎
6. Explanation of the formula used to determine the optimal order quantity that minimizes total inventory costs. ↩︎
7. Definition of the duration between the start and completion of a production or supply chain process. ↩︎
8. High-authority medical source from the American Academy of Ophthalmology explaining how polarized lenses function. ↩︎
More Articles You Might Like

August 1, 2026
Should Factory Handle Kids Sunglasses Packaging & Labeling, or Use a Designated Supplier?

August 1, 2026
Own Warehouse vs Supplier Direct Fulfillment: Which Cuts Return Costs for Kids Sunglasses Brands?

August 1, 2026
Direct-to-Port Warehouse or Overseas Staging: Which Saves More on Kids Sunglasses Shipping?
Looking for a Reliable Kids Eyewear Partner?
Explore 800+ ready styles and full OEM/ODM support tailored to your brand.
Get in Touch English
  Español de México
  Deutsch
  Français
  日本語
日本語  العربية
  Português do Brasil