How to Use Historical Sales Data to Calculate Replenishment Ratios for Kids Optical Frames?

Calculating replenishment ratios for kids optical frames from historical sales data 1 is a question our buyers ask constantly — usually right after a stockout wiped out their back-to-school season.
To calculate replenishment ratios for kids optical frames, divide annual unit sales by your desired inventory turns to set target stock, then reorder when on-hand units fall below expected sales during supplier lead time plus safety stock, adjusting for seasonality and age-group demand.
That formula sounds simple. The hard part is knowing which data to track, how far back to look, and how to adjust the numbers for children’s eyewear sell-through rate 2. Let me walk you through each step.
What Historical Sales Data Should I Track to Predict Replenishment Needs for Kids Optical Frames?
A distributor in Australia once sent me a spreadsheet with only monthly revenue totals and asked us to plan her reorders. Our team had to explain why that single column was not enough.
Track units sold per SKU, sell-through rate by size and color, stockout dates, warranty and replacement claims, and monthly sales by age group over at least six to twelve months. Units, not revenue, drive replenishment math for kids optical frames.
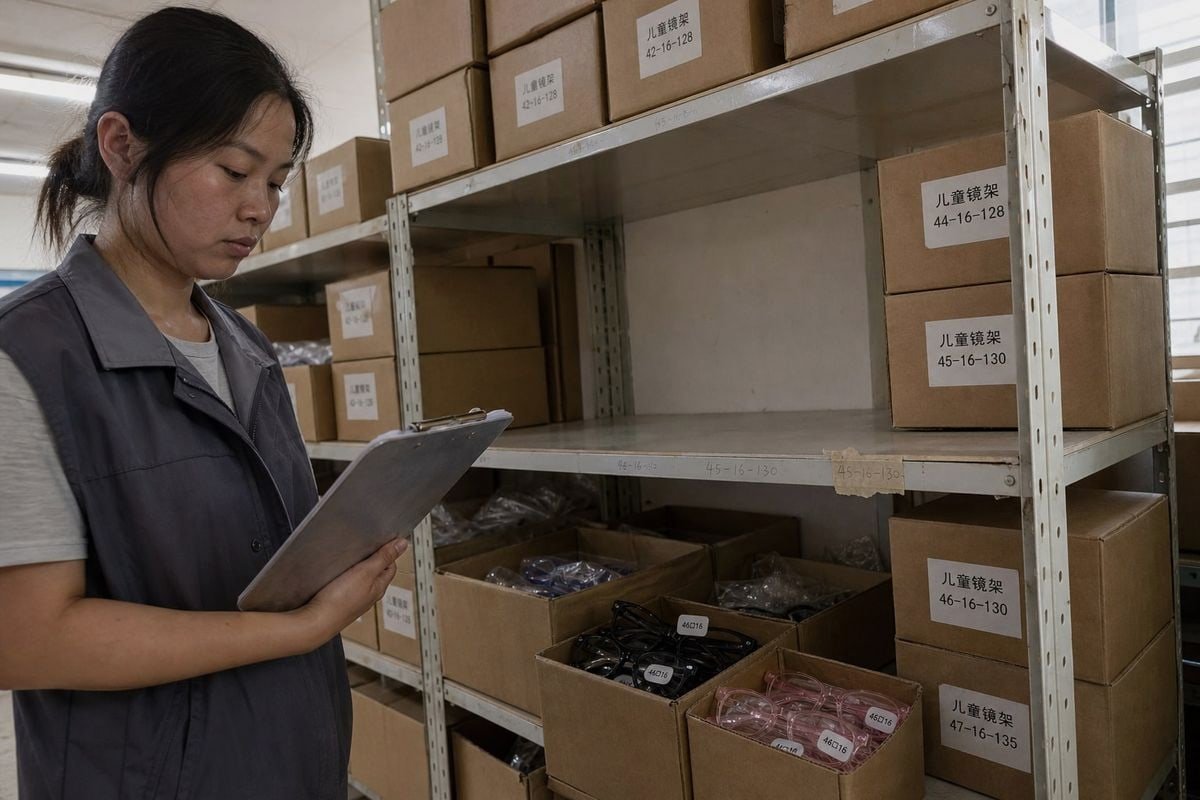
Revenue tells you how much money moved. It does not tell you how many frames left the shelf. Replenishment is a unit-count problem, so units sold must be your foundation. In our fifteen years supplying children's eyewear, the buyers who reorder smoothly are the ones who track a short, disciplined set of numbers every month.
The Core Data Points
Good optical inventory management for the pediatric segment starts with these fields, tracked per SKU:
| Data Point | Why It Matters for Kids Frames |
|---|---|
| Units sold per month | The base number for every replenishment formula |
| Sell-through by size (44–48mm eye sizes, etc.) | Kids sizing is narrow; one missing size kills a sale |
| Stockout dates and duration | Lost sales hide real demand; note when shelves went empty |
| Warranty and replacement claims | Active kids break frames; replacements add hidden demand |
| Returns and reasons | Fit problems reveal sizing gaps in your assortment |
| Average selling price | Confirms your price-point mix matches your customer demographics |
How Far Back Should You Look?
Use six months of data at minimum. Use twelve months if you can. Children's eyewear sales trends are seasonal — school calendars, sports seasons, and insurance deadlines all bend the curve. A six-month window that misses back-to-school will mislead you badly.
One more point from our experience with retail analytics in the optical channel: track stockouts as carefully as sales. If a popular TR90 frame in a small eye size sold out for three weeks, your recorded sales understate true demand. Add an estimate for those lost weeks before you calculate anything. Modern inventory control software can flag these gaps automatically, but even a simple spreadsheet works if you update it monthly.
How Do I Calculate the Right Reorder Ratio for Each Frame Style and Size?
There is a trade-off we weigh with every OEM client: hold more stock and tie up cash, or hold less and risk losing a fitting-room sale. The math below resolves that tension.
Divide each style's annual unit sales by your target frame turn rate — typically three to five turns per year — to get target on-hand stock. Then set a reorder point equal to average weekly demand multiplied by lead time weeks, plus safety stock.

Let me make this concrete, because abstract formulas rarely change buying behavior. When we help importers plan their first orders from our catalog of roughly 800 existing styles, we walk them through three linked calculations. Each one uses only historical sales data and two decisions you make yourself: your desired turn rate and your safety buffer.
The Three Formulas
- Target stock = Annual unit sales ÷ Desired turns per year
- Reorder point (ROP) = (Average weekly demand × リードタイム 3 in weeks) + Safety stock 4
- Reorder quantity = Target stock − Current on-hand inventory
A Worked Example
Suppose a flexible TR90 kids frame with TPEE temples sold 36 units last year. You want 4 inventory turns 5 annually. Your supplier lead time is 5 weeks.
| 子供用アイウェアの5段階QC計画 | Calculation | Result |
|---|---|---|
| Weekly demand | 36 ÷ 52 | ≈ 0.7 units/week |
| Target stock | 36 ÷ 4 turns | 9 units on hand |
| Lead-time demand | 0.7 × 5 weeks | ≈ 3.5 units |
| Safety stock | Buffer for size/color spread | 2–3 units |
| 再注文ポイント | 3.5 + 2.5 | Reorder at 6 units |
| Reorder quantity | 9 − 6 | Order 3–4 units |
Now, an objection I hear often: some consultants suggest lower benchmarks, around 3 turns and a larger total board, while others push for 3–6 turns and call anything under 2 turns a discontinuation candidate. Both camps are right for different practices. Treat these as a range, not a law. A pediatric-focused practice with deep size runs may accept slower turns on core fitting sizes because a missed fit means a lost family, not just a lost frame. What matters is that you choose your target turn rate deliberately, apply it per SKU, and review it monthly. Frame turn rate is a decision, not just a measurement.
Can Seasonal Trends and Age Group Demand Affect My Replenishment Calculations?
Every July, our Taizhou production line runs at full tilt. Buyers in the northern hemisphere are stocking for back-to-school, and the orders that arrive in August are already too late.
Yes — seasonality and age-group demand significantly change replenishment math. Back-to-school, sports seasons, and insurance-benefit deadlines create demand spikes, while toddler, elementary, and pre-teen segments each need separate ratios because sizing, styles, and replacement rates differ across age groups.

Averages lie. If you calculate a flat monthly demand of 3 units for a frame that actually sells 8 units in August and 1 unit in February, you will stock out during your best month and sit on dead stock during your worst. That is why demand forecasting 6 for the children's eyewear market must work month by month, not year by year.
Map the Kids Eyewear Calendar
From what we see across orders from 20+ countries, pediatric demand clusters around predictable events. Build a simple seasonal index from your own monthly history:
| Period | Typical Demand Driver | Replenishment Action |
|---|---|---|
| 6–8 weeks before school starts | Vision screenings, back-to-school prep | Raise safety stock on core sizes; order early |
| Sports season kickoffs | Rx sports eyewear and durable frames | Deepen flexible frame materials for children |
| Year-end (Nov–Dec) | Insurance benefit deadlines | Boost fast movers; avoid slow-mover reorders |
| Late winter | Post-holiday lull | Cull weak SKUs; rebalance the board |
Segment by Age Group, Not Just "Kids"
A toddler frame and a pre-teen frame are different products with different behavior. Toddlers need small eye sizes, soft silicone temple tips, and bendable materials — and they break or outgrow frames faster, which raises replacement demand. Pre-teens shift toward adult-adjacent styling, like the translucent pink acetate shapes we produce for tween lines, and their purchases track fashion cycles more closely. Split your historical sales data into at least three bands — toddler, elementary, pre-teen — and calculate a separate replenishment ratio for each. If your customer demographics skew young because you sit near schools or serve a pediatric vision care referral network, your kids share of inventory should exceed the common 10% benchmark. Let your own data set that number.
How Do I Work With My Manufacturer to Turn Sales Data Into a Reliable Reorder Plan?
A lesson we learned the hard way: years ago, a European client shared her sell-through data with us only after a stockout crisis. Once she shared it quarterly, her fill rate problems disappeared.
Share your SKU-level sell-through data with your manufacturer, agree on fixed lead times and minimum order quantities, set a standing reorder calendar aligned to seasonal peaks, and reserve production capacity for your proven core styles before high-demand periods arrive.
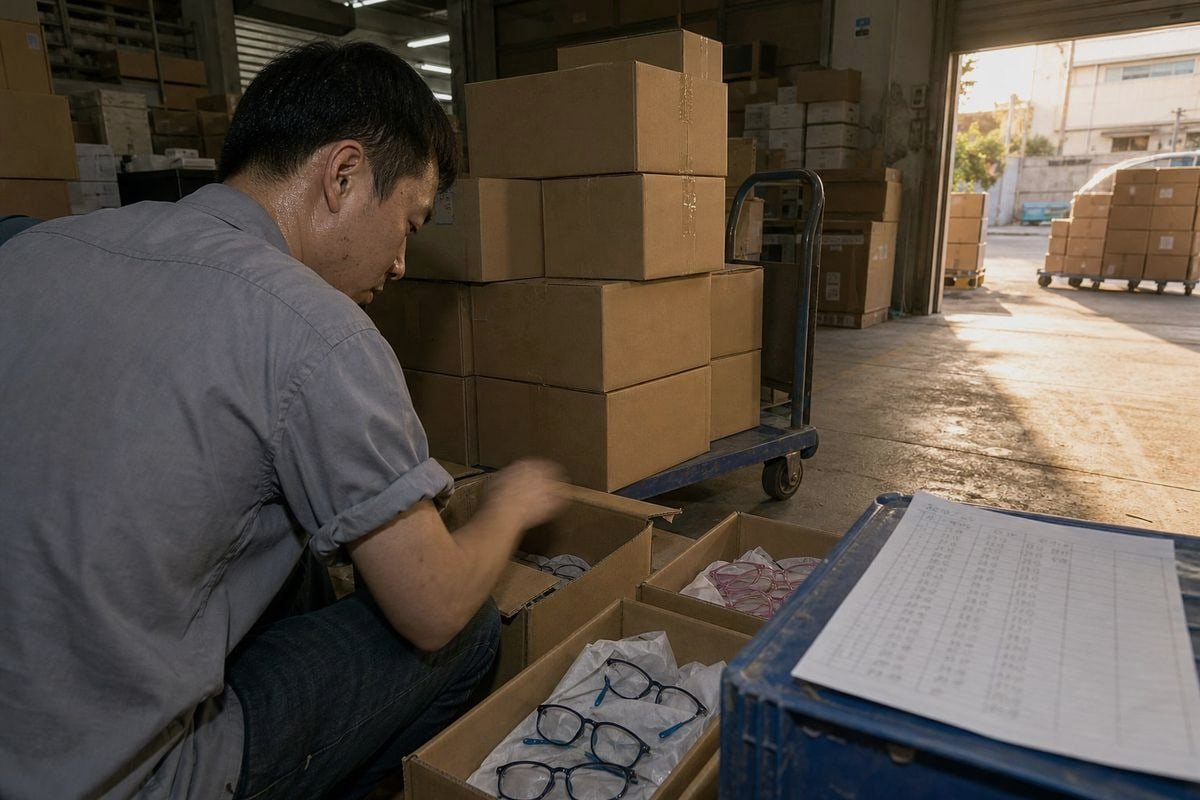
Your replenishment math is only as reliable as the lead time behind it. If your reorder point assumes 5 weeks and your supplier ships in 9, the formula fails and the shelf goes empty. So the manufacturer relationship is not separate from the calculation — it is a variable inside it. Here is how we structure this with our own B2B partners, and what you should ask of any factory.
Build a Data-Sharing Rhythm
You do not need to hand over your whole business. Share three things per quarter: units sold by SKU, current on-hand stock, and your next-quarter forecast. With that, a capable factory can pre-book materials and slot your reorders into production before the rush. On our side, when a brand's historical data shows a TR90 optical style turning fast in two colorways, we flag it for priority scheduling ahead of their back-to-school window. That single habit protects stock level optimization better than any formula alone.
Negotiate the Variables That Feed Your Formula
Every term below plugs directly into your reorder point:
- Lead time. Get it in writing, including peak-season lead time, which is often longer.
- MOQ flexibility. Smaller minimums on proven repeat styles let you reorder closer to true demand.
- Color and size splits. Reordering only the sizes that sold keeps your ratio honest.
- Ready-made styles. Choosing from an existing catalog — we maintain around 800 styles — shortens development time to zero and lets you test demand before committing to custom molds.
Close the Loop Monthly
Finally, review the plan monthly against actuals. If a style consistently beats forecast, raise its target stock. If it turns under 2 times a year and it is not a strategic fitting size, cut it. Optical practice profitability depends on this discipline: every frame on the board must earn its space, and your manufacturer should help you act on that data quickly rather than push you toward bigger orders.
結論
Stockouts lose families; dead stock drains cash. Replenishment ratios built from your historical sales data — demand, lead time, safety stock — turn kids frame reordering from guesswork into repeatable, profitable math.
脚注
1. Replaced HTTP 404 with a relevant and authoritative article on using historical data for inventory forecasting. ↩︎
2. Explains sell-through rate as an inventory management KPI and its calculation. ↩︎
3. Provides a clear definition of lead time in the context of supply chain management. ↩︎
4. Defines safety stock as extra inventory to reduce stockout risk and its importance. ↩︎
5. Provides a comprehensive definition and explanation of inventory turnover in accounting. ↩︎
6. Defines demand forecasting as using historical data to anticipate future customer demand. ↩︎



 English
  Español de México
  Deutsch
  Français
  日本語
日本語  العربية
  Português do Brasil